TidyTuesday Creations
a collection of data visualizations and models
TidyTuesday is a weekly community activity put on the the Data Science Learning Community. I try to spend a little time each week creating a data visualization or model with the data posted to the official TidyTuesday GitHub Repository (linked below).
Highlighted Creations
Here are some of my favorite data visualizations that I have made from TidyTuesday over the past two years. Each title has a link to my code for creating the visualization.
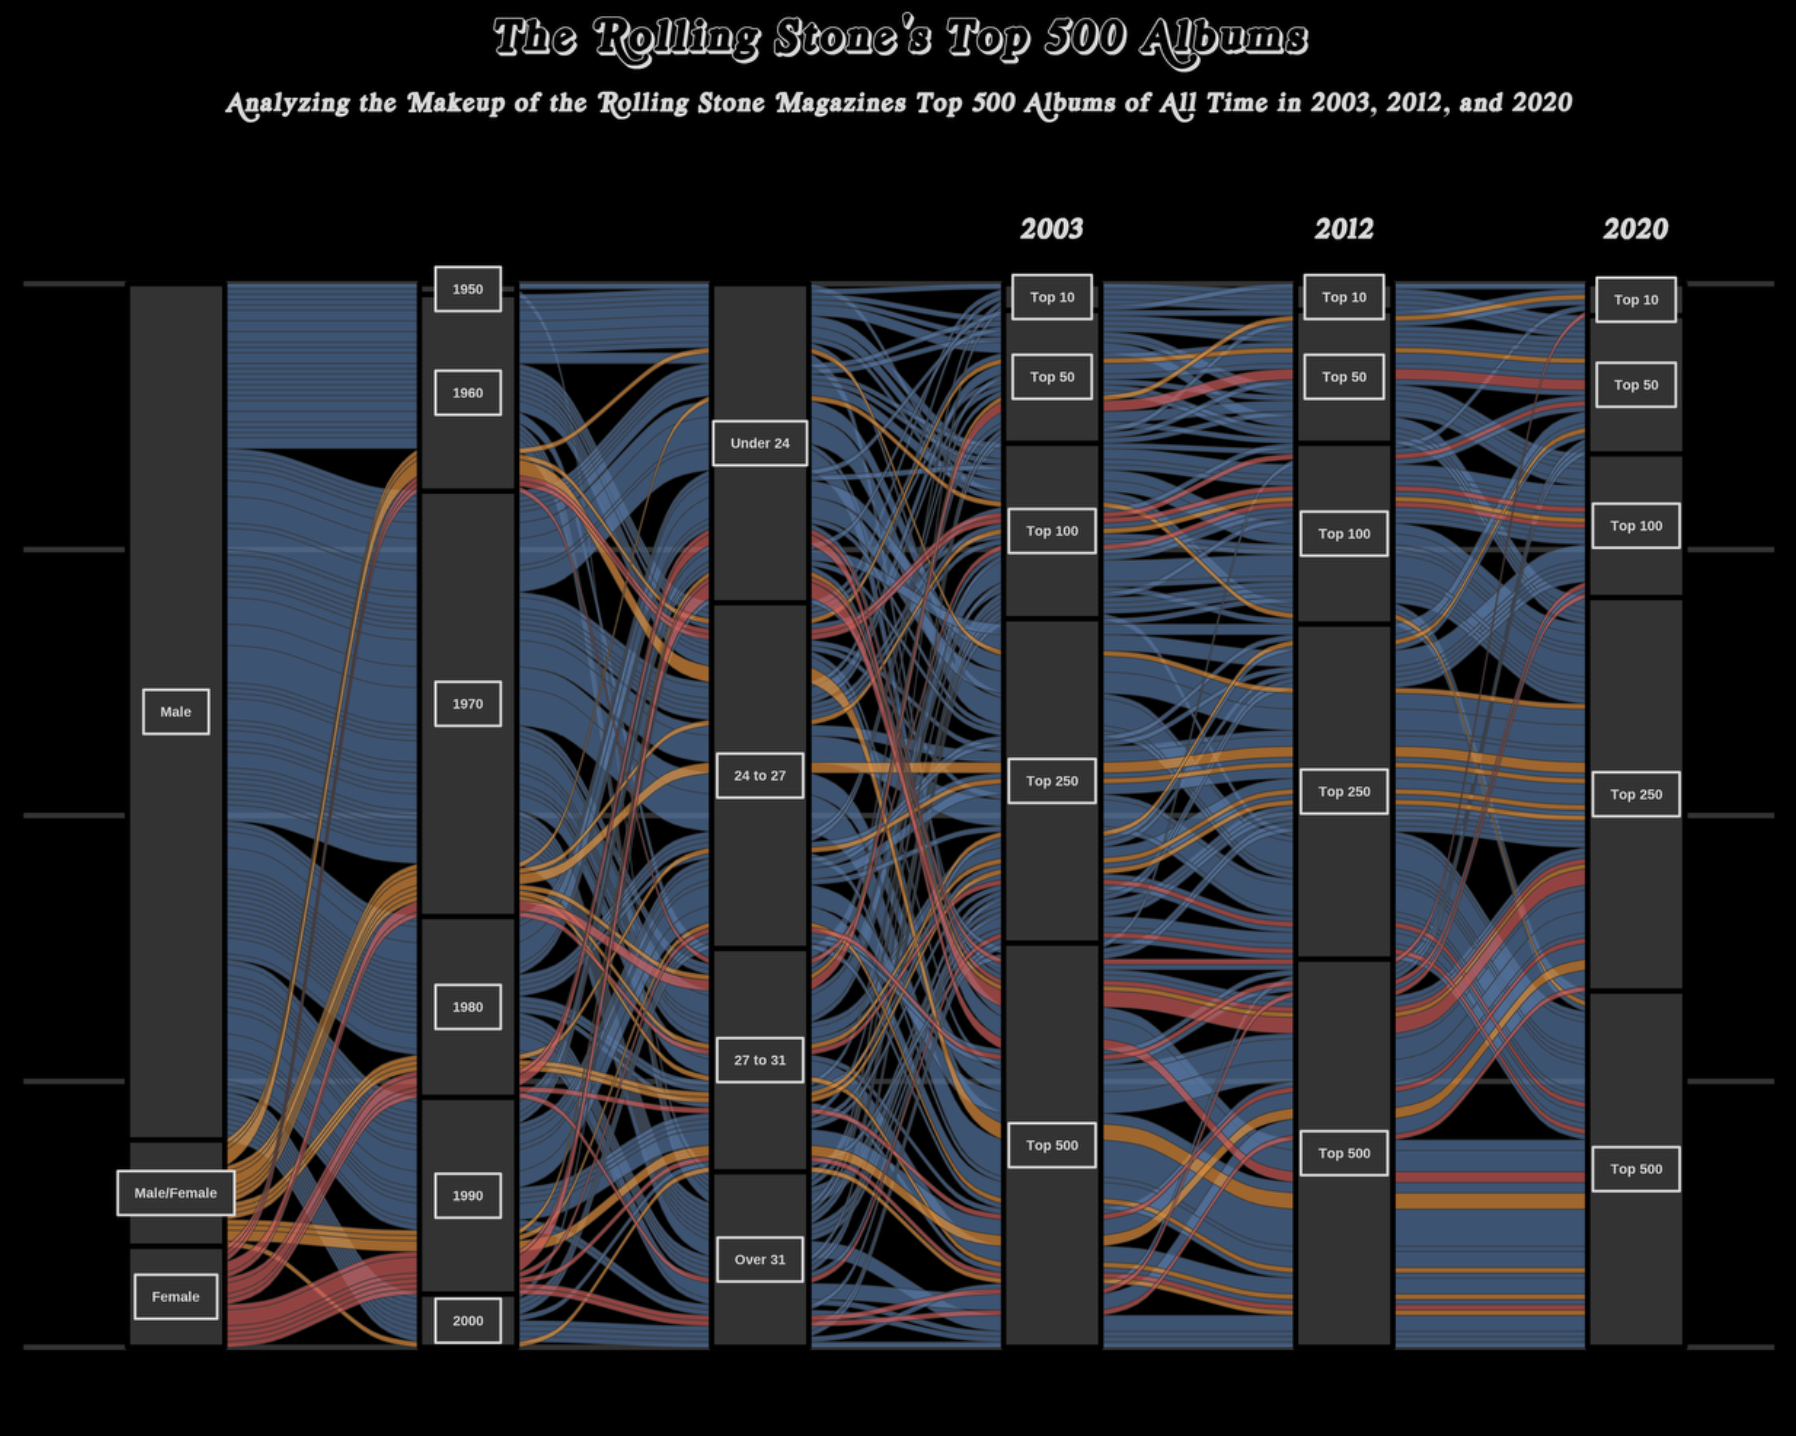
05/07/2024: Demographics of the Rolling Stone’s Top 500 Albums of All Time in 2003 vs. 2012 vs. 2020
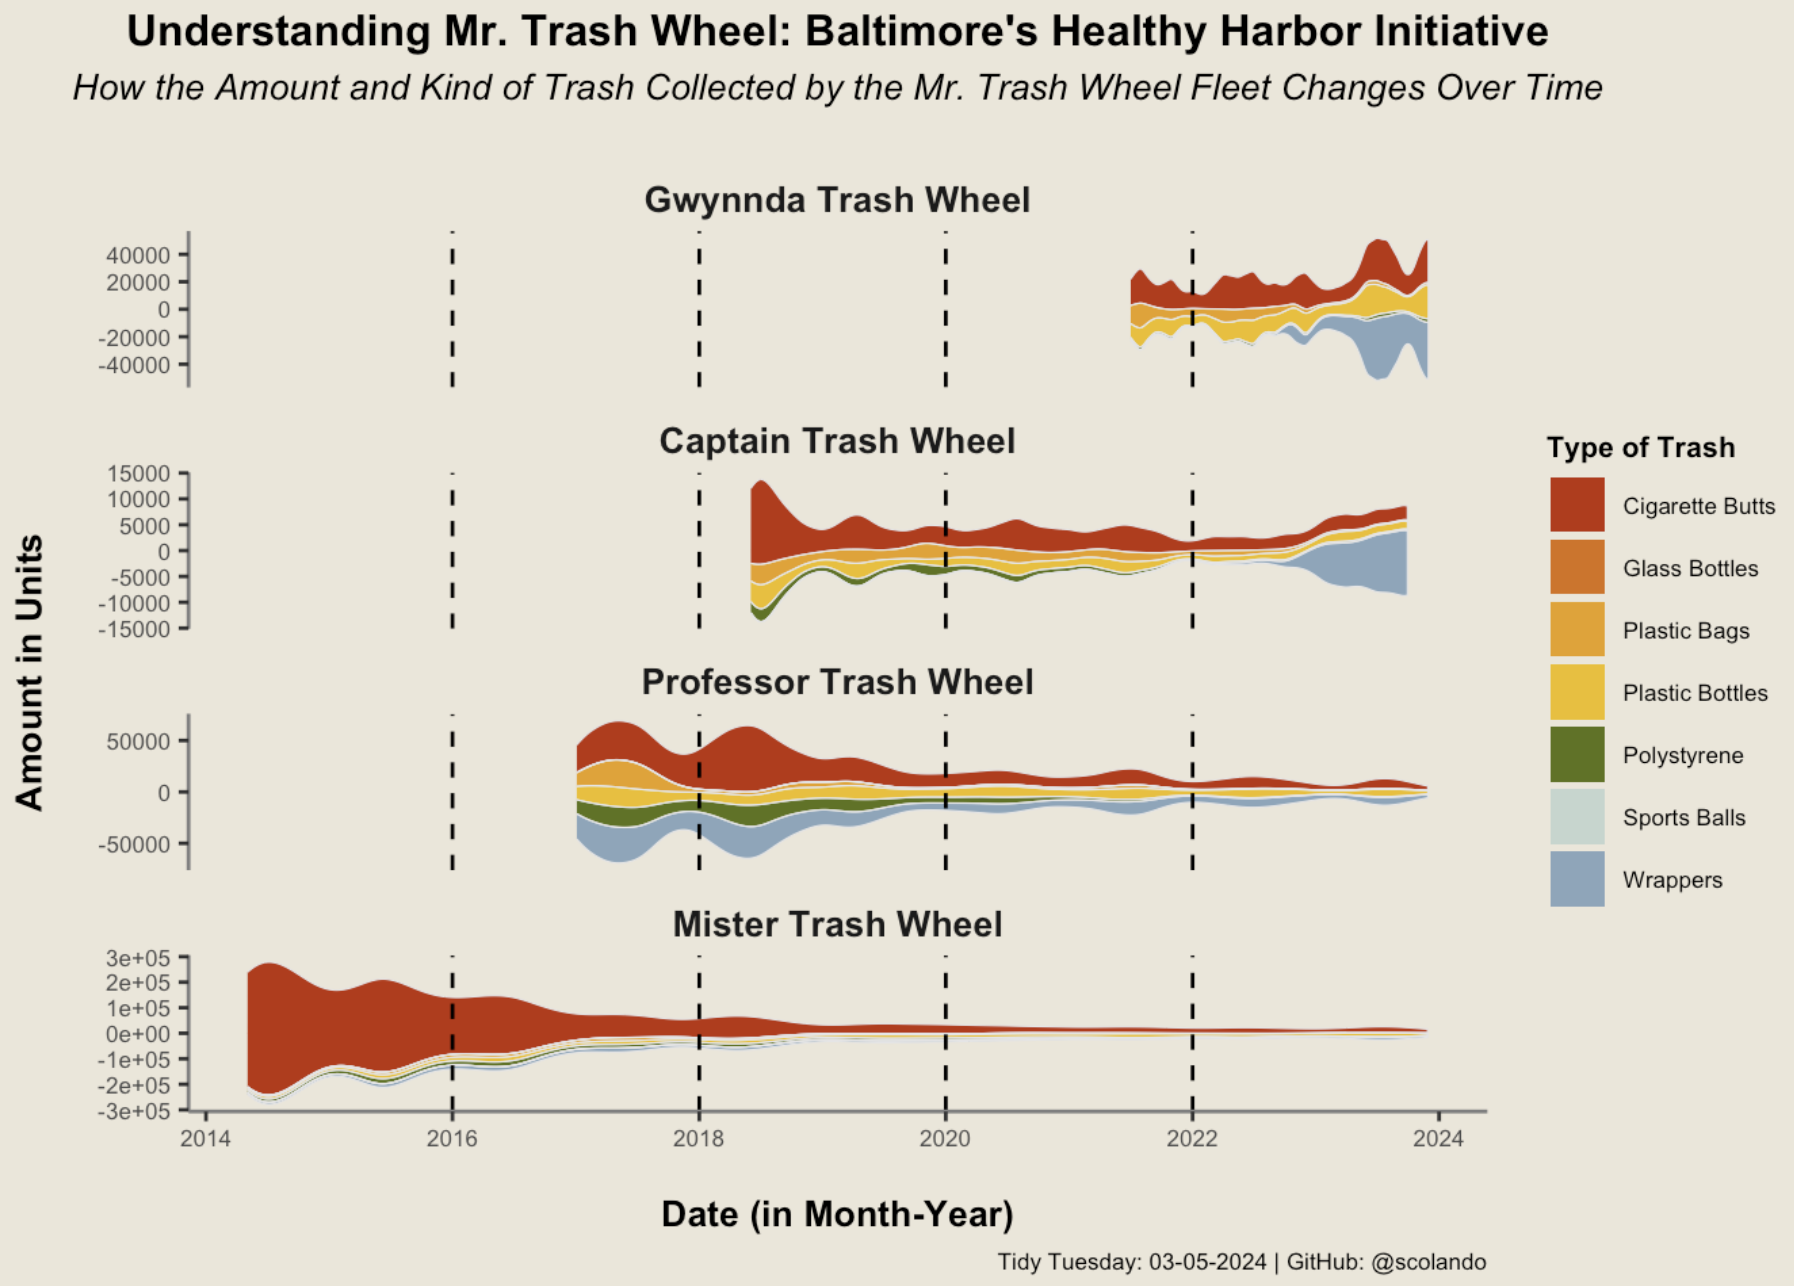
03/05/2024: The Mr. Trash Wheel Fleet’s Collected Garbage over the Years
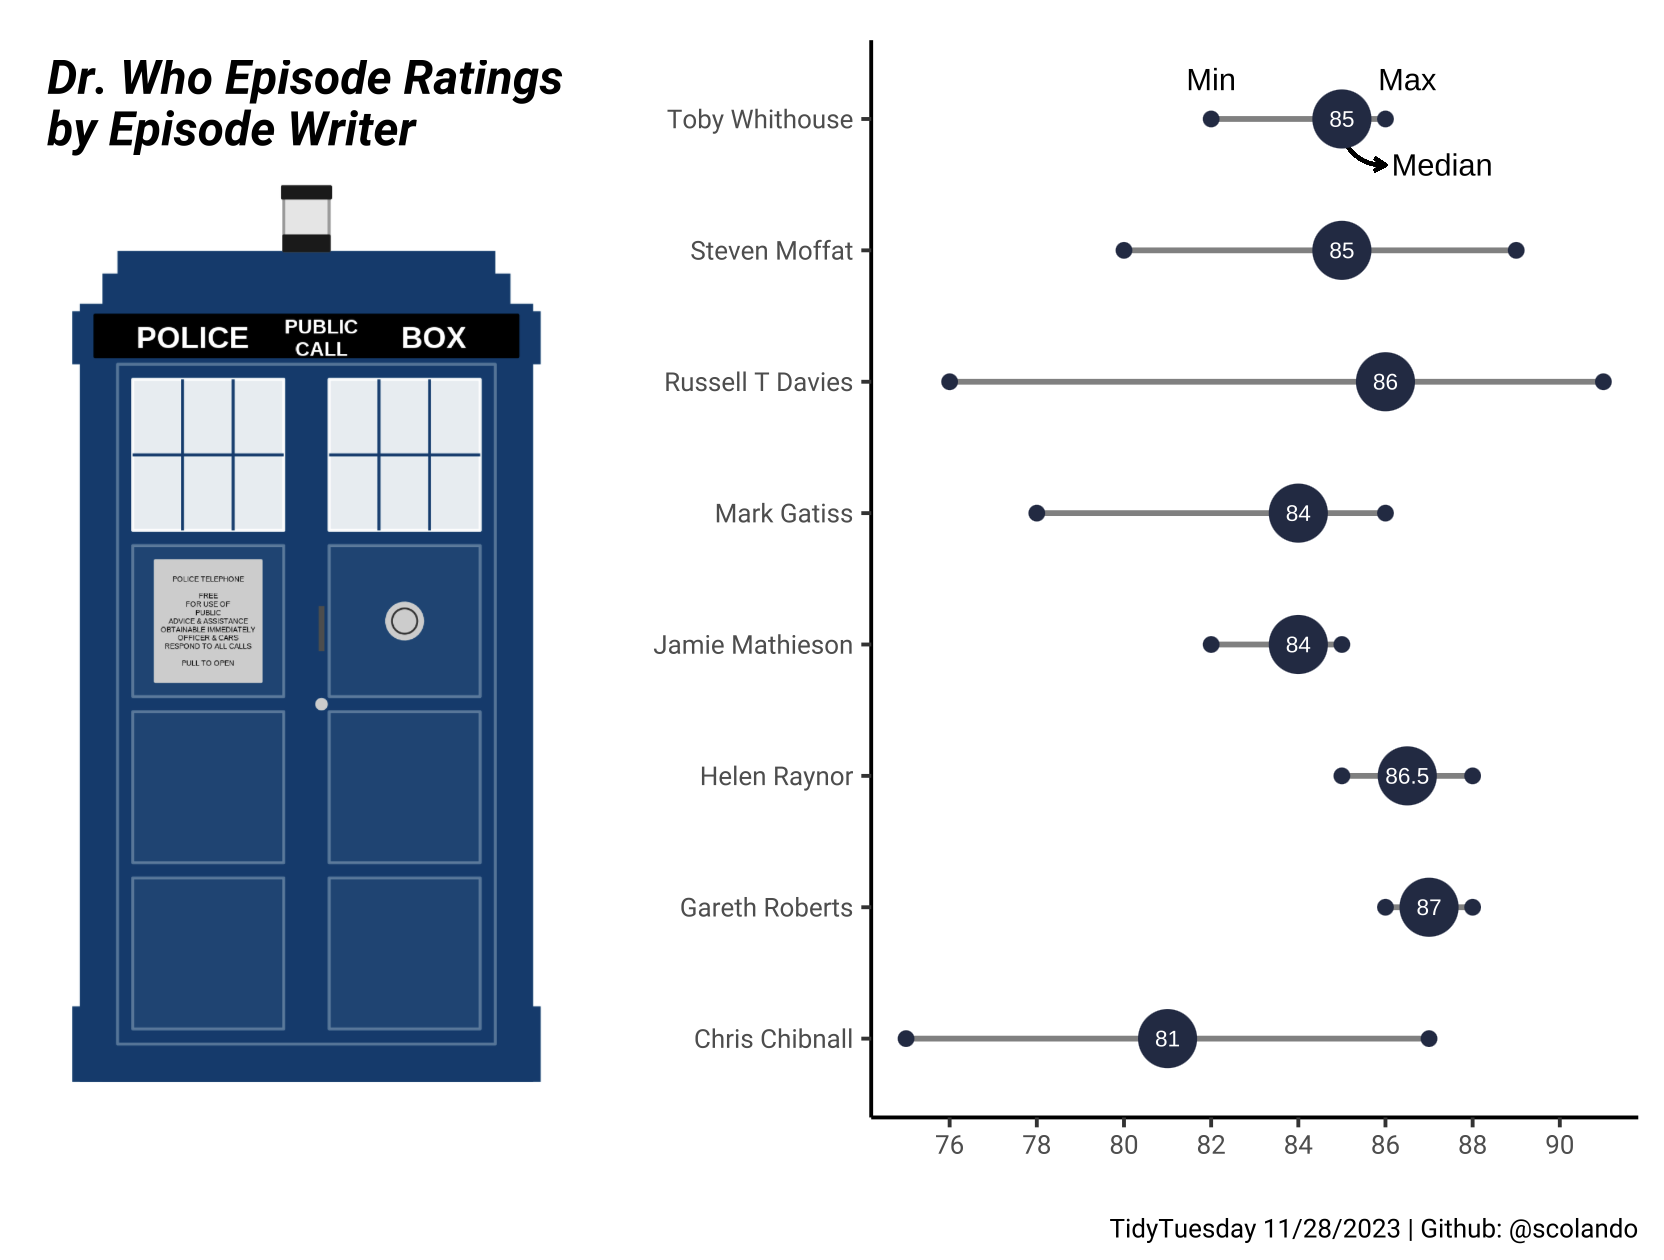
11/28/2023: Dr. Who Distribution of Episode Rankings Based on the Episode Writer
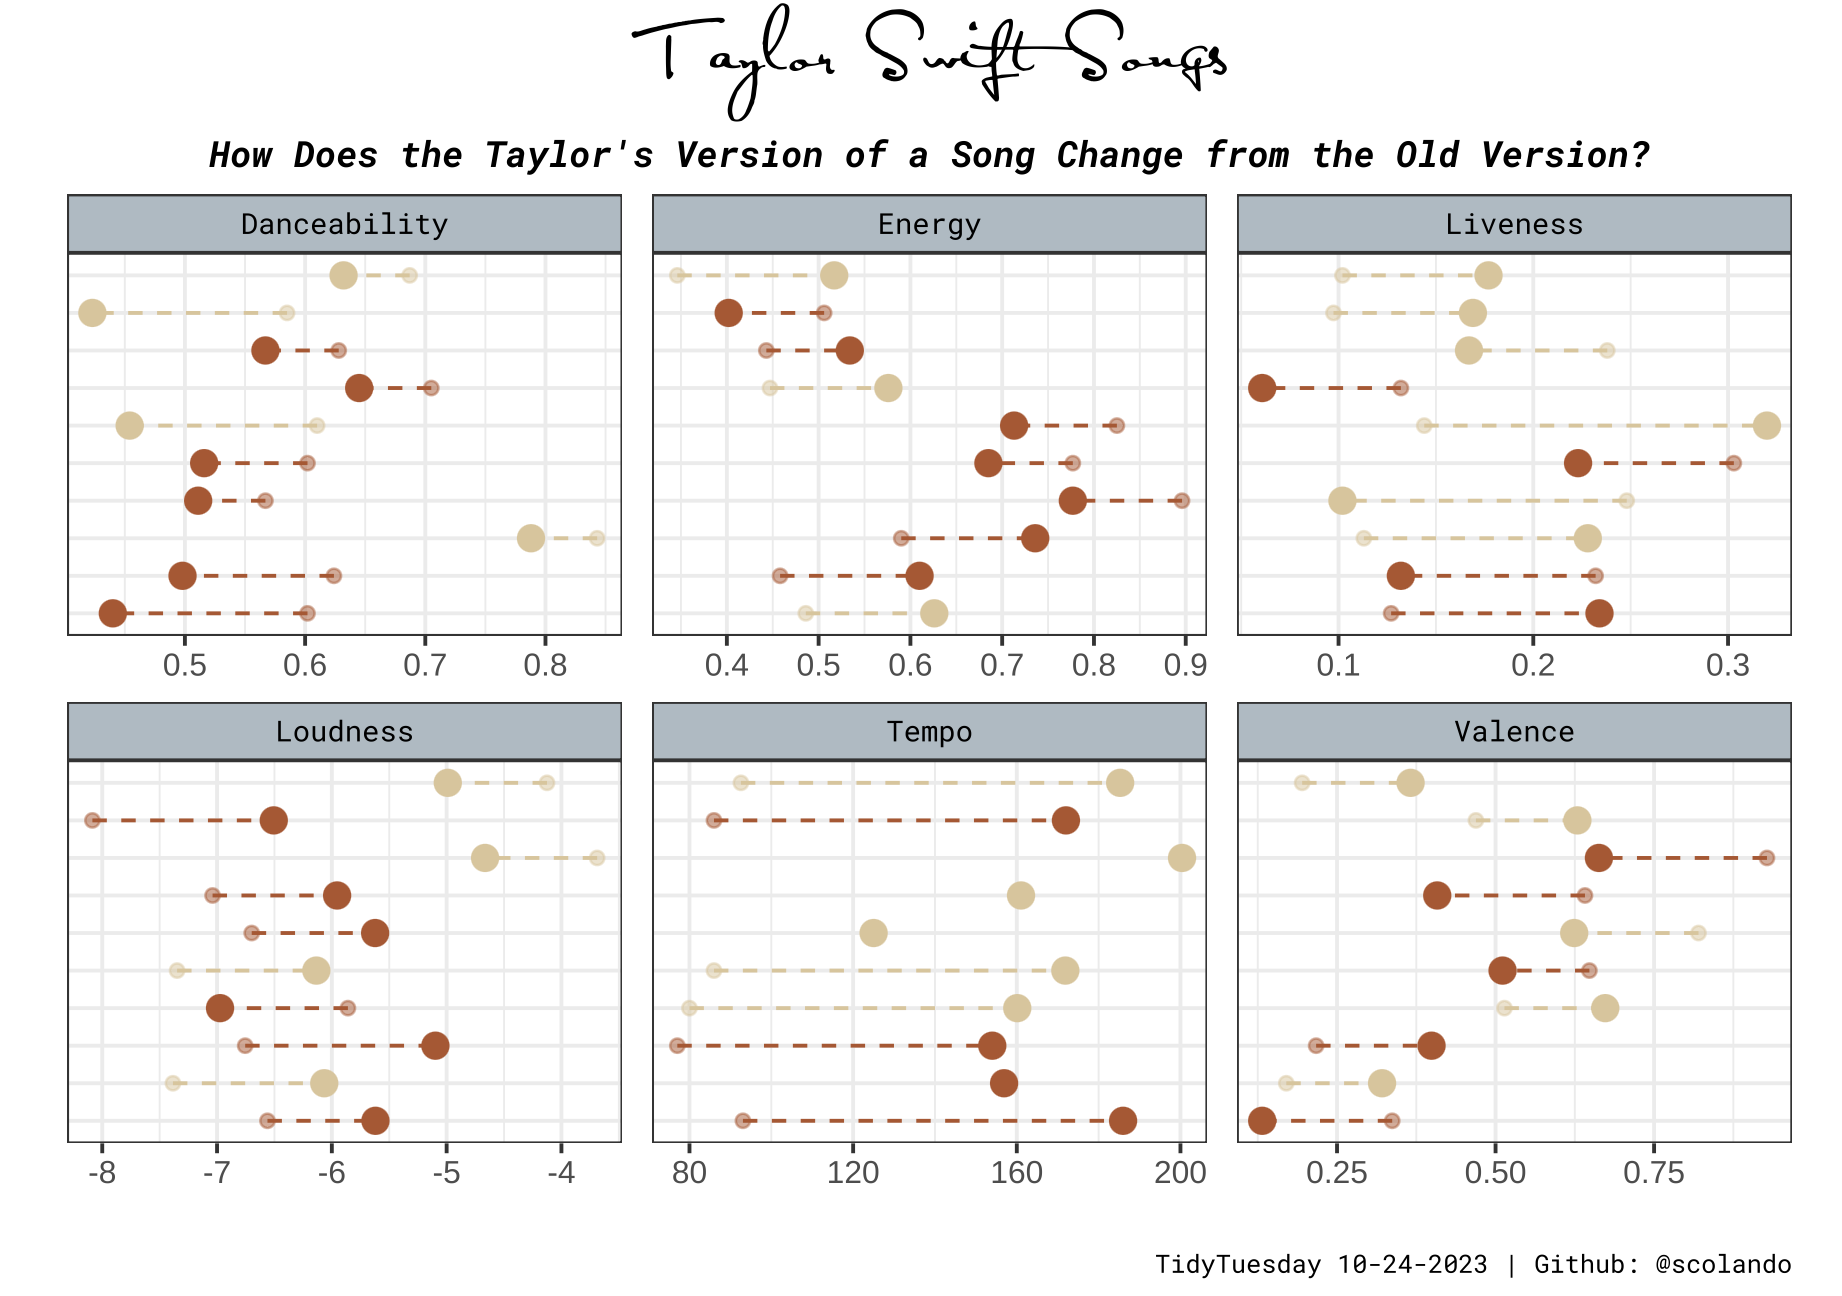
10/24/2023: Difference between the Taylor’s Version and the Old Version of Songs from Fearless and Red
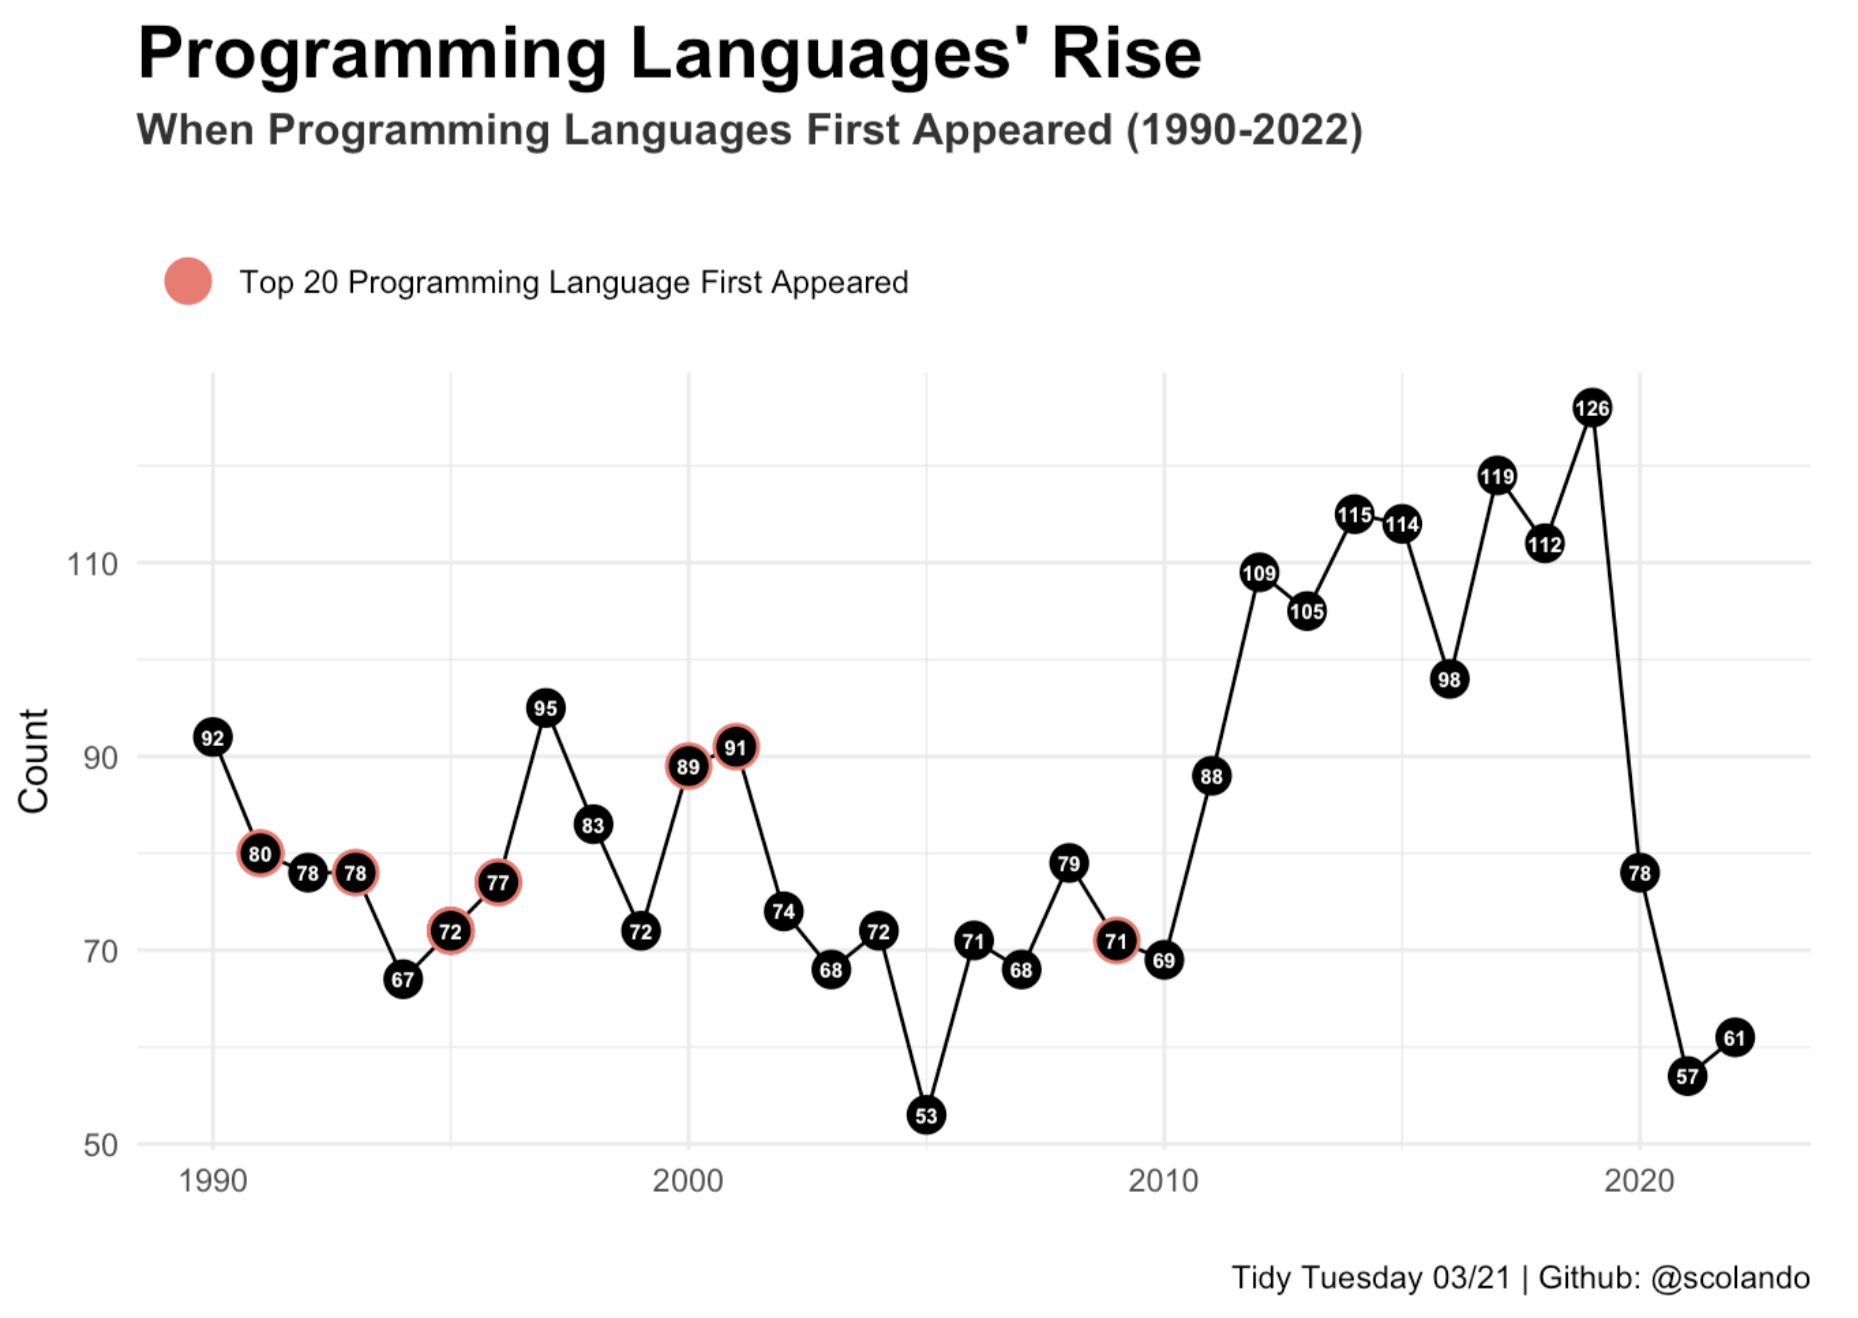
03/21/2023: Coding Language Creation over the Years
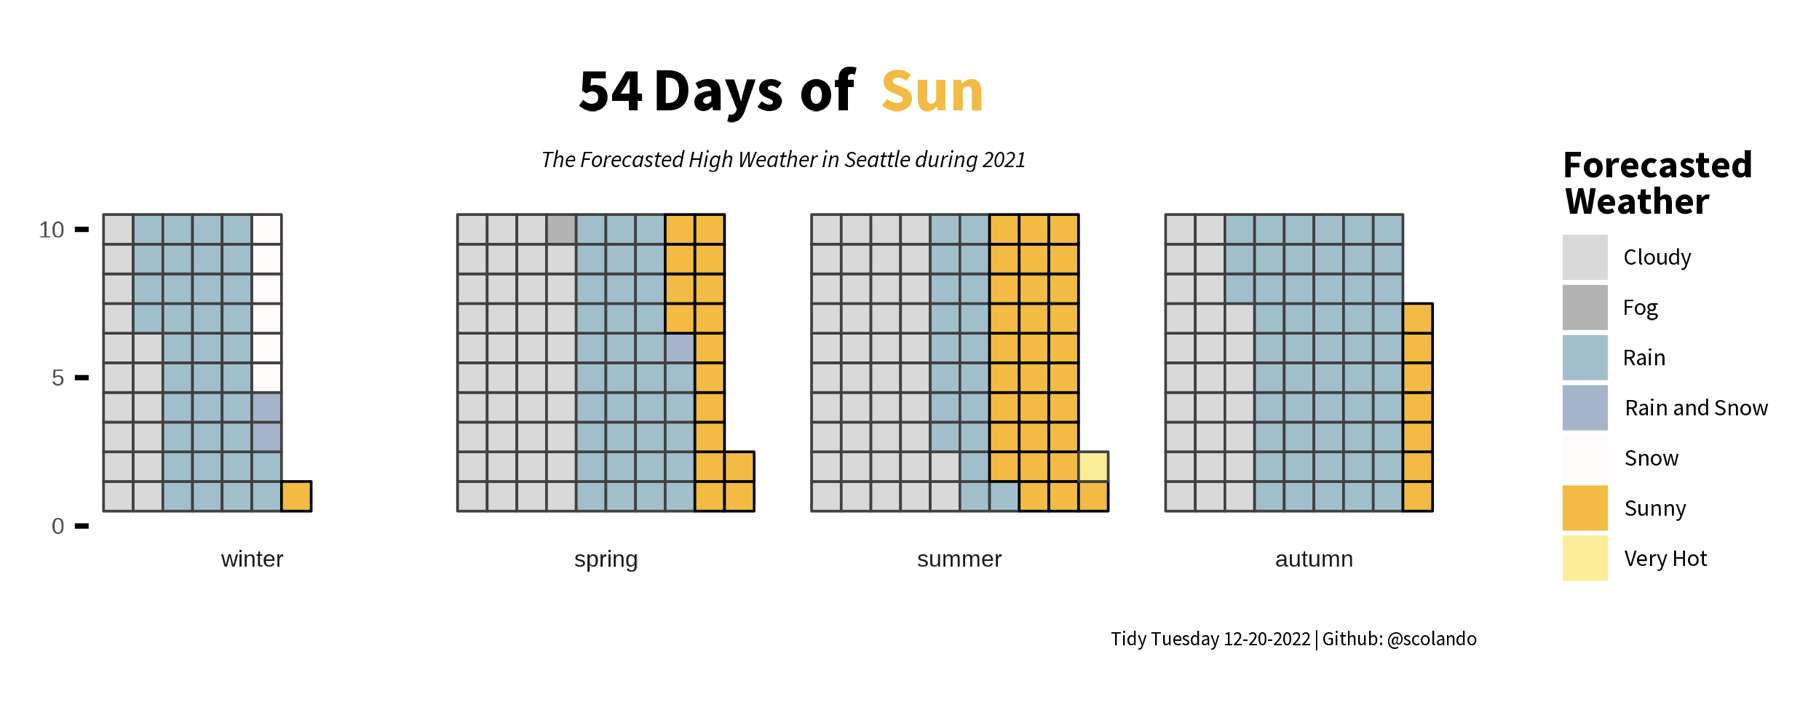
12/20/2022: Seattle Weather in 2021
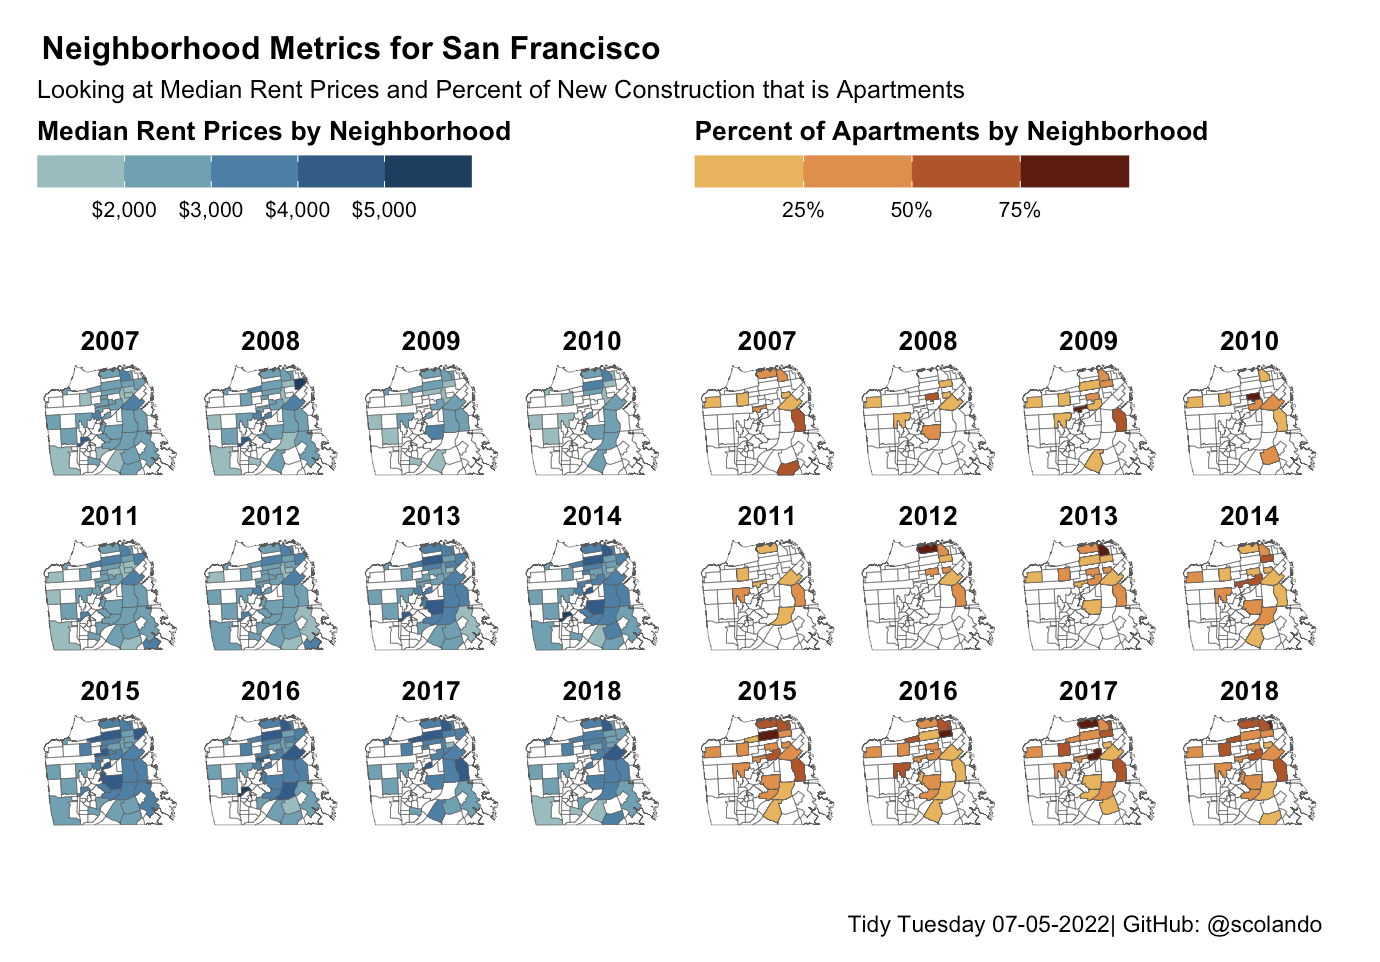
07/05/2022: Changes in Median Rent Prices and Percent of Apartments by Neighborhood in San Francisco
Helpful Resources
If you are interested in participating in TidyTuesday yourself, here are some resources that I have found helpful for starting:
1. Finding Inspiration
When beginning TidyTuesdays, I find it super helpful to take inspiration from what others have done with the data either this week or in previous weeks. X (i.e., Twitter), Fossodon, and sometimes even Google searches are a great way of gaining inspiration from others!
2. Loading in the Data
Usually, I read the data into an .Rmd file using the code block that looks like the following:
```{r}
dataset_1 <- readr::read_csv('https://raw.githubusercontent.com/rfordatascience/tidytuesday/master/data/2024/some_date/dataset_1.csv')
```
3. Analyzing and Visualizing the Data
After that, the world (or, in this case, data) is your oyster! I primarily use Tidyverse to create my TidyTuesday data visualizations and models, so I appreciate the following cheat sheets: