The Data Science Lifecycle

motivating our selected data science lifecycle and how different lifecycles make value judgements about what exactly data represents in our world.


Introduction

To take an interdisciplinary perspective on aligning what we should do and our moral duties to stakeholders with our actual data science practices, we must understand where common ethics topics emerge in data science. This requires us to choose a data science lifecycle that characterizes how interactions with our world are transformed into data models. Though it might not be explicit, choosing one lifecycle over another endorses specific views about data, data models, and their respective relationships to what we interpret as knowledge about our world. Thus, the choice to use a certain data science lifecycle is value-laden, an important point to reiterate to students. Below, we describe the relational view of data and data models, a framework that is likely very familiar to statisticians and data scientists.

Data Science Lifecycle Definition

A data science lifecycle is diagram that depicts a relationship between different stages of data science (e.g., data collection, data cleaning, model-building).

Data Models Definition

“Arrangements of data that are evaluated, manipulated and modified with the explicit goal of representing a phenomenon, which is often (though not always) meant to capture specific aspects of the world,” (Leonelli, 2019)

Examples of Data Models:

  1. A simple linear regression that uses years of education to model a person’s expected income.

  2. An algorithm that utilizes millions of hyperparameters to predict an incarcerated individual’s risk of recidivism.

  3. A data visualization that describes a relationship between variables within a sample.


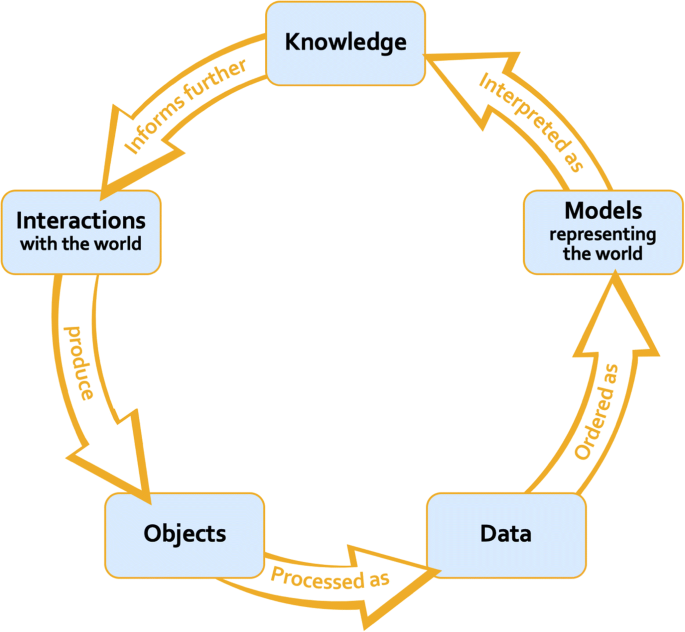
The Relational View of Data and Data Models


Under the relational view of data and data models, data is understood as an object that is treated as evidence for a claim about the world and that can be circulated amongst individuals or groups (Leonelli, 2019). The informational content of data depends on the researchers’ background assumptions and social context. So, information is not inherent to the data but is instead defined by the social environment in which the data is collected and the function the data is supposed to serve. The view that context plays an integral role in what data represents is also emphasized within the statistics community. As statisticians George Cobb and Thomas Moore famously claimed, ``[data] are numbers with a context” (Cobb & Moore, 1997). Given data is context-sensitive in the sense that its informational content is influenced by researchers’ assumptions and social contexts, data models (rather than the data itself) are taken to represent relationships in our world under the relational view. Thus, the relational view of data and data models highlights that data models are a necessary and highly influential aspect of what we take to be knowledge about our world in data science (Leonelli, 2019).

Data Science Lifecycle under the Relational View of Data and Models conceptualized by Sabina Leonelli in 2019. The lifecycle is represented as a circle with 5 stages. The stages of inquiry include: (1) 'Interactions with the World', which produce (2) 'Objects', which are processed as 'Data', which are ordered as (4) 'Models representing the World', which is then interpreted as (5) 'Knowledge'. What is interpreted as (5) 'Knowledge' further informs (1) 'Interactions with the World'.
Figure 1: Data Science Lifecycle under the Relational View of Data and Models conceptualized by Leonelli (2019).

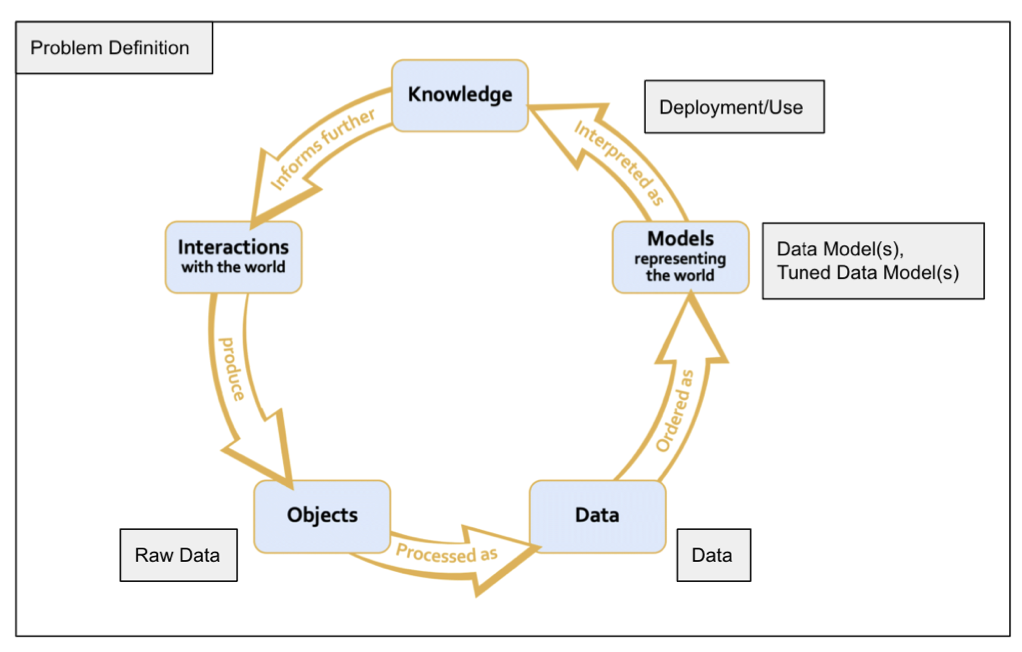
The Final Data Science Lifecycle


Given that the relational view aligns well with data science examples (see Appendix), we use the data science lifecycle in Figure 2 throughout this paper and on the associated website. Beyond aligning well with data science examples, the lifecycle shown in Figure 2 also fits with the data science processes described in what is data science ethics?. Figure 2 showcases how the data science processes connect to our final data science lifecycle. However, other data science lifecycles could also be compatible with the relational view of data and data models as well as the described data science processes (we outline some potential shortcomings of our final lifecycle in the Appendix for instructors who want to have their students walk through the pros and cons of working with different versions of the data science lifecycle). As such, we acknowledge that our selected lifestyle, depicted in Figure 2, is not the only viable choice.

Data Science Lifecycle under the Relational View of Data and Models conceptualized by Sabina Leonelli in 2019. The lifecycle is represented as a circle with 5 stages. Data Collection belongs to (1) Interactions with the World. Data Processing creates (2) Objects. Data Cleaning produces (3) Data. Exploratory Data Analysis is an intermediary between (3) Data and (4) Models. Machine Learning, Algorithms, Statistical Models are paradigmatic examples of (4) Models representing the World. Deployment of (4) Models creates interpretations of (5) Knowledge, which includes Communication, Visualizations, Report-Findings, and Decision making. Finally, (5) Knowledge informs further (1) Interactions with the world via Data Product Development.
Figure 2: Data science lifecycle under the relational view of data and data models, superimposed with the data science processes, described in what is data science ethics?. “Raw Data” is equivalent to objects, which is processed into “Data”. Data Model(s) result from ordering data in a particular way (e.g., as a linear regression). “Tuned Data Model(s)” also result from ordering data. However, tuned models usually involve more data (e.g., additional data collected because the data model(s) was unsuccessful with respect to some chosen metric or different data (e.g., test data) than the original data model(s). “Deployment/Use” involves interpreting knowledge from the model(s). “Problem Definition” affects the entire lifecycle, which is why the “Problem Definition” box surrounding the entire lifecycle (e.g., how we define the question we want to answer with data and model success influences what raw data we process and how we tune our model). The layout for this figure was inspired by the diagram on pg. 58 of Beaulieu & Leonelli (2021).

Appendix


In the appendix, we provide worked-out examples and describe some of the limitations of the lifecycle we used in this paper to underscore the value of judgment in defining relationships between data, the world, and knowledge. We hope that our examples lead to interesting and fruitful classroom discussions.

Even though, as highlighted in the relational view of data and data models subsection, it makes the most sense to think of data and data models using a relational view, it is worth noting (and pointing out to students) that there exist alternative frameworks in which to consider data and data models. Here, we examine the representational view of data, data models, and their connections to what we interpret as knowledge about our world (Leonelli, 2019).

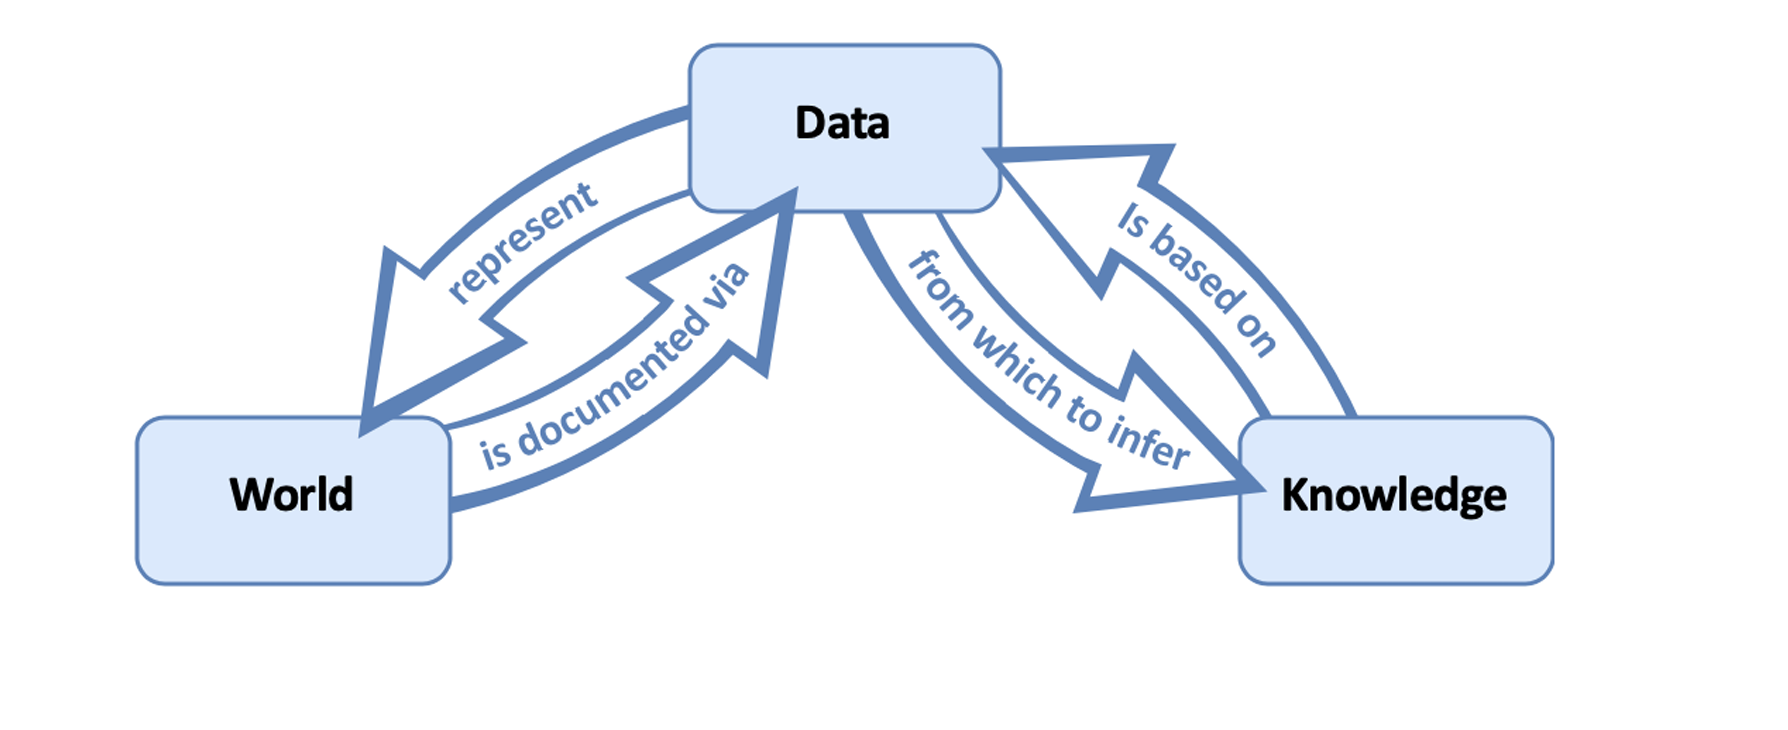
The Representational View

Under the representational view of data and data models (see Figure 3), the informational content of data is fixed and independent of the researchers’ background assumptions and context. Thus, data models are only important insofar as they extract the underlying truth from the data. So, under the representational view, data models are either correct or incorrect, depending on their ability to elucidate the truth stored in the data. In other words, data are simply numbers that hold information, and data models (and other methods of processing data) are only relevant because they clarify the connections between data and what we interpret to be knowledge (Leonelli, 2019).1

Data Science Lifecycle under the Representational View of Data and Models described by Sabina Leonelli in 2019. The lifecycle is represented as a circle with 3 components that all interact with one another. The components include: (1) World, (2) Data, and (3) Knowledge. (1) World is documented via (2) Data and (2) Data represents (1) World. Additonally, (3) Knowledge is based on (2) Data and (2) Data is used to infer (3) Knowledge.
Figure 3: Data science lifecycle under the representational view of data and models as formulated by Leonelli (2019).

The Relational vs. Representational View In-Practice

Example 1: Predicting the Likelihood that a Person Buys Concert Tickets

Suppose we are interested in predicting a person’s likelihood of buying concert tickets from a particular website. To do so, we collect data about the number of times they clicked on an advertisement for concert tickets from that particular website, the timestamps of these ad clicks, the person’s demographic information, et cetera.

However, it is unclear what exactly the data we gather should be taken to represent. We concede that we cannot directly measure a person’s interest in buying concert tickets, but we believe that someone’s interest is correlated to how often they interact with online ads for the tickets. So, we decide to use a person’s number of ad clicks as a proxy for their interest in buying concert tickets. However, this proxy is imperfect. For instance, a person might click on a ticket ad in order to determine how much to resell their concert tickets for.

Furthermore, using particular data as evidence can sometimes influence future interactions with the world. Imagine that we find that when a website displays, “less than 1% of tickets remaining”, the person is much more likely to buy concert tickets. As a result, other ticket sites adopt this strategy in an attempt to sell more tickets. However, suppose there is only a strong correlation between displaying the message`less than 1% of tickets remaining” and a person’s likelihood of buying tickets when no other site displayed a similar message. Namely, when other sites also display the message “less than 1% of tickets remaining,” displaying the message on our site will no longer increase the person’s likelihood of buying tickets from our site. What this example demonstrates is that by treating the display message data as evidence for there being a correlation between displaying the message and the likelihood of buying a ticket, we have changed how future users will interact with our site.

Unlike the representational view, the relational view acknowledges that data’s informational content is influenced by researchers’ background assumptions and social contexts. Furthermore, the relational view endorses that data can be dynamic, and what we take as evidence can influence future interactions with the world. Thus, the concert ticket example described above gives us reason to endorse the relational view of data and data models over the representational view.

Example 2: Predicting the Likelihood that a Player Receives a Red Card in Soccer

In Silberzahn et al. (2017), 29 data analysis teams were asked to use the same data set to determine ``whether soccer referees are more likely to give red cards to dark-skin-toned players than light-skin-toned players.” Despite operating from the same data set, the final conclusions were split: 20 teams found that there was a statistically significant positive relationship, and 9 teams did not find a significant association between skin tone and the likelihood of the referee giving a red card.

The difference in the chosen data model type and the relative importance of the potential predictor variables contributed to the division in the teams’ findings:

  • 15 teams used logistic models, 6 teams used Poisson models, 6 teams used linear models, and 2 teams used other types of models.
  • 21 of 29 teams used unique combinations of predictor variables.

Through Silberzahn et al. (2017), we can also see how ambiguity about the data model and the relative importance of certain predictor variables impacts what data is taken as evidence. No two teams had the same set of evidence for their claim about the relationship between skin tone and the likelihood of the referee giving a red card. As emphasized by Silberzahn et al. (2017), each team’s evidence set was defensible based on the original data set provided. Yet, these evidence sets were also subjective in the sense that they relied upon the analysts’ background assumptions, value judgments, and social contexts. These subjective factors ultimately influenced what the analysts interpreted as the true relationship between the player’s skin tone and the likelihood of the referee giving the player a red card. Hence, the Silberzahn et al. (2017) case study emphasizes that data and data models should be viewed relationally rather than representationally.


Final Data Science Lifecycle Caveats

For instructors who seek to walk their students through the advantages and disadvantages of specific data science lifecycles, we note some flaws with our selected lifecycle (see Figure 2). First, the arrows between the data science stages imply that the data science is linear (i.e., only when all prior steps are complete is the next step pursued). However, in practice, data science is iterative; for example, data scientists may build a data model, realize their model underperforms on a certain group, and then collect more data to improve the model’s performance. Another shortcoming of our final lifecycle in Figure Figure 2 is that it does not highlight how many different people (or groups) are often involved in different stages of the lifecycle. For instance, a company might collect the data and then bring in an external group of data scientists to create a meaningful model from that data. The fact that different people (or groups) act at different stages of data science is essential both for understanding how data science practices are actually carried out as well as why understanding certain ethics topics (such as moral responsibility) is integral to data science. As such, we move forward with our final data science lifecycle in the spirit of George E. P. Box, “all models are wrong, but some are useful,” (Box, 1979).

References

Beaulieu, A., & Leonelli, S. (2021). Data and society: A critical introduction (First). SAGE Publications Ltd.
Box, G. E. P. (1979). Robustness in the strategy of scientific model building. In R. L. Launer & G. N. Wilkinson (Eds.), Robustness in statistics (pp. 201–236). Academic Press. https://doi.org/https://doi.org/10.1016/B978-0-12-438150-6.50018-2
Cobb, G. W., & Moore, D. S. (1997). Mathematics, statistics, and teaching. The American Mathematical Monthly, 104(9), 801–823. Retrieved from http://www.jstor.org/stable/2975286
Leonelli, S. (2019). What distinguishes data from models? European Journal for Philosophy of Science, 9. https://doi.org/10.1007/s13194-018-0246-0
Silberzahn, R., Uhlmann, E., Martin, D., Anselmi, P., Aust, F., Awtrey, E., … Nosek, B. (2017). Many analysts, one dataset: Making transparent how variations in analytical choices affect results. Advances in Methods and Practices in Psychological Science.

Footnotes

  1. What we interpret as knowledge is not the same as actual knowledge. E.g., the statement “the Earth is flat” was historically interpreted as knowledge, even though it is a false statement and thus not actual knowledge.↩︎